The Dashboard tab is going to house all your Journey data. There are several sections that make up the Dashboard, read on to learn more.
Candidate Risk Assessment
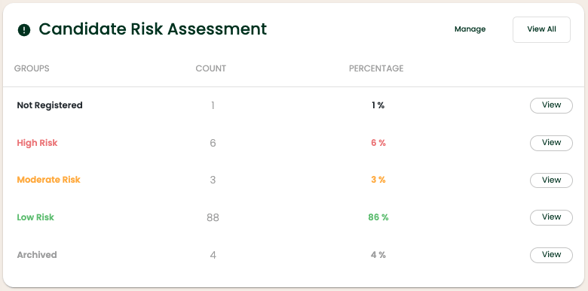
The Candidate Risk Assessment chart is going to compile your candidates’ Progress and organize them into 5 groups. The default view of the Dashboard tab is going to present aggregate level data for all your Journey Templates.
- Not Registered- any candidate who hasn't created an Abode account
- High Risk - candidates who fall below 33% progress in their Journey
- Moderate Risk - candidates who fall between 33-66% progress in their Journey
- Low Risk - candidates who are above 66% progress in their Journey
- Archived - candidates who's Journeys were ended for various reasons (this is controlled by you)
The chart is also going to display several Data Columns to provide the following information:
- Count - will tell you how many individual Candidates fall into each category
- Percentage - will tell you the percent of Candidates that fall into each category
- View - this button will redirect you to the Candidates Tab and automatically filter to show you that specific Group of candidates for easy viewership
Note: The Candidate Risk Assessment is going to default to an aggregate view for ALL your Journey Templates. Use the filter in the upper right hand corner to look at individual Templates.
Manage Risk Assessment
You have the ability to update the preset levels that organize three of the five groups of the Risk Assessment by following these steps:
Step 1: Navigate to you Dashboard
Step 2: Click Manage on the upper right hand corner of the Candidate Risk Assessment box. This will open the below side bar:
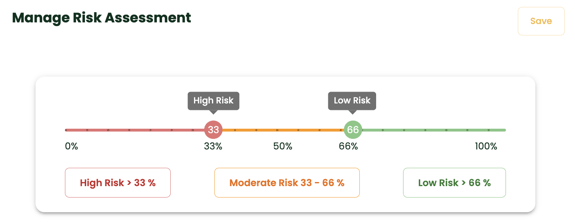
Step 3: Slide the High and Low Risk markers until they reflect the new ranges you want
Step 4: Click Save in the top right hand corner
Tip: You can always reset these levels by following Steps 1 - 2 and then clicking Reset Settings in the lower right hand corner.
High Level Data Points
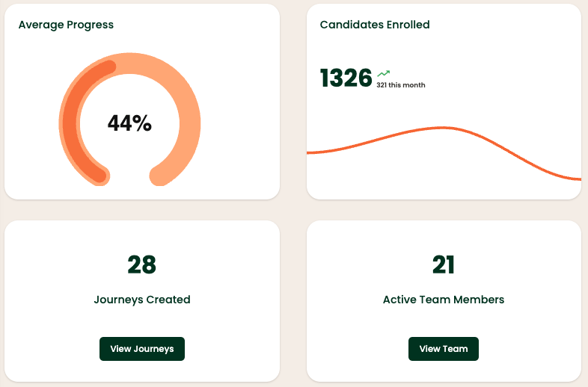
The following items are tracked at the Aggregate and Template level as well:
- Average Progress
- Number of Candidates Enrolled
- Number of Journeys Created
- Active Team Members
Template Specific View
Using the filter in the upper right hand corner, you are able to narrow the scope and view data that just pertains to one Template. Once you make a Template selection, you will be able to see all the data points covered in the article above. However, you will have access to two new areas of data as well: Step data and Survey Results.
Step Level Data
The following Categories are available for each Step and piece of Content within it.
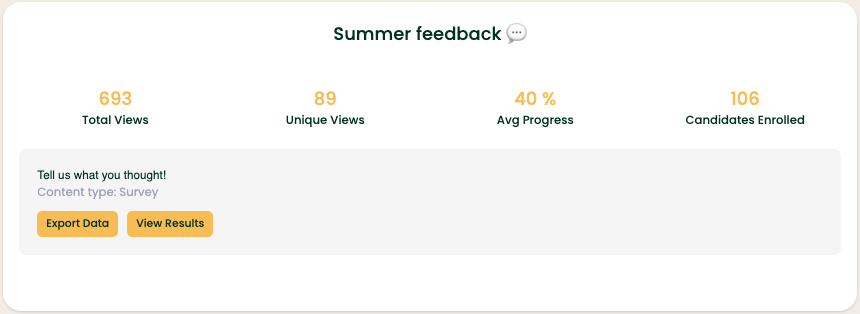
- Total Views: gross number of views per Step or piece of Content
- Unique Views: total number of individual candidates who have viewed it
- Avg Progress
- Candidates Enrolled
Additional data points are going to populate for the following Content types:
- Surveys: from the Step view, you can quickly export the results or jump to the Survey Results section (see below for more information)
- Content Upload:
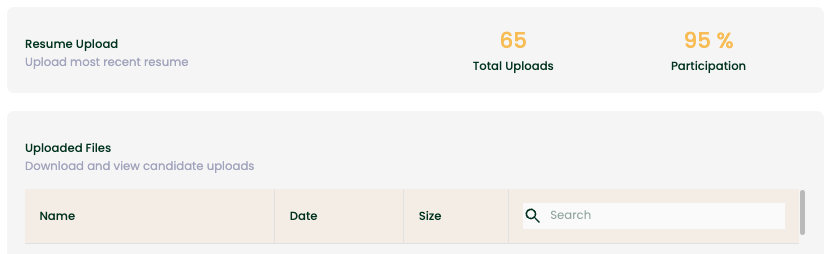
- Videos: Total Plays and Average Duration %
Survey Results
The Survey Results section is broken into 3 Sections and can be viewed by Survey:
- Analytics
- Questions
- Individual Responses
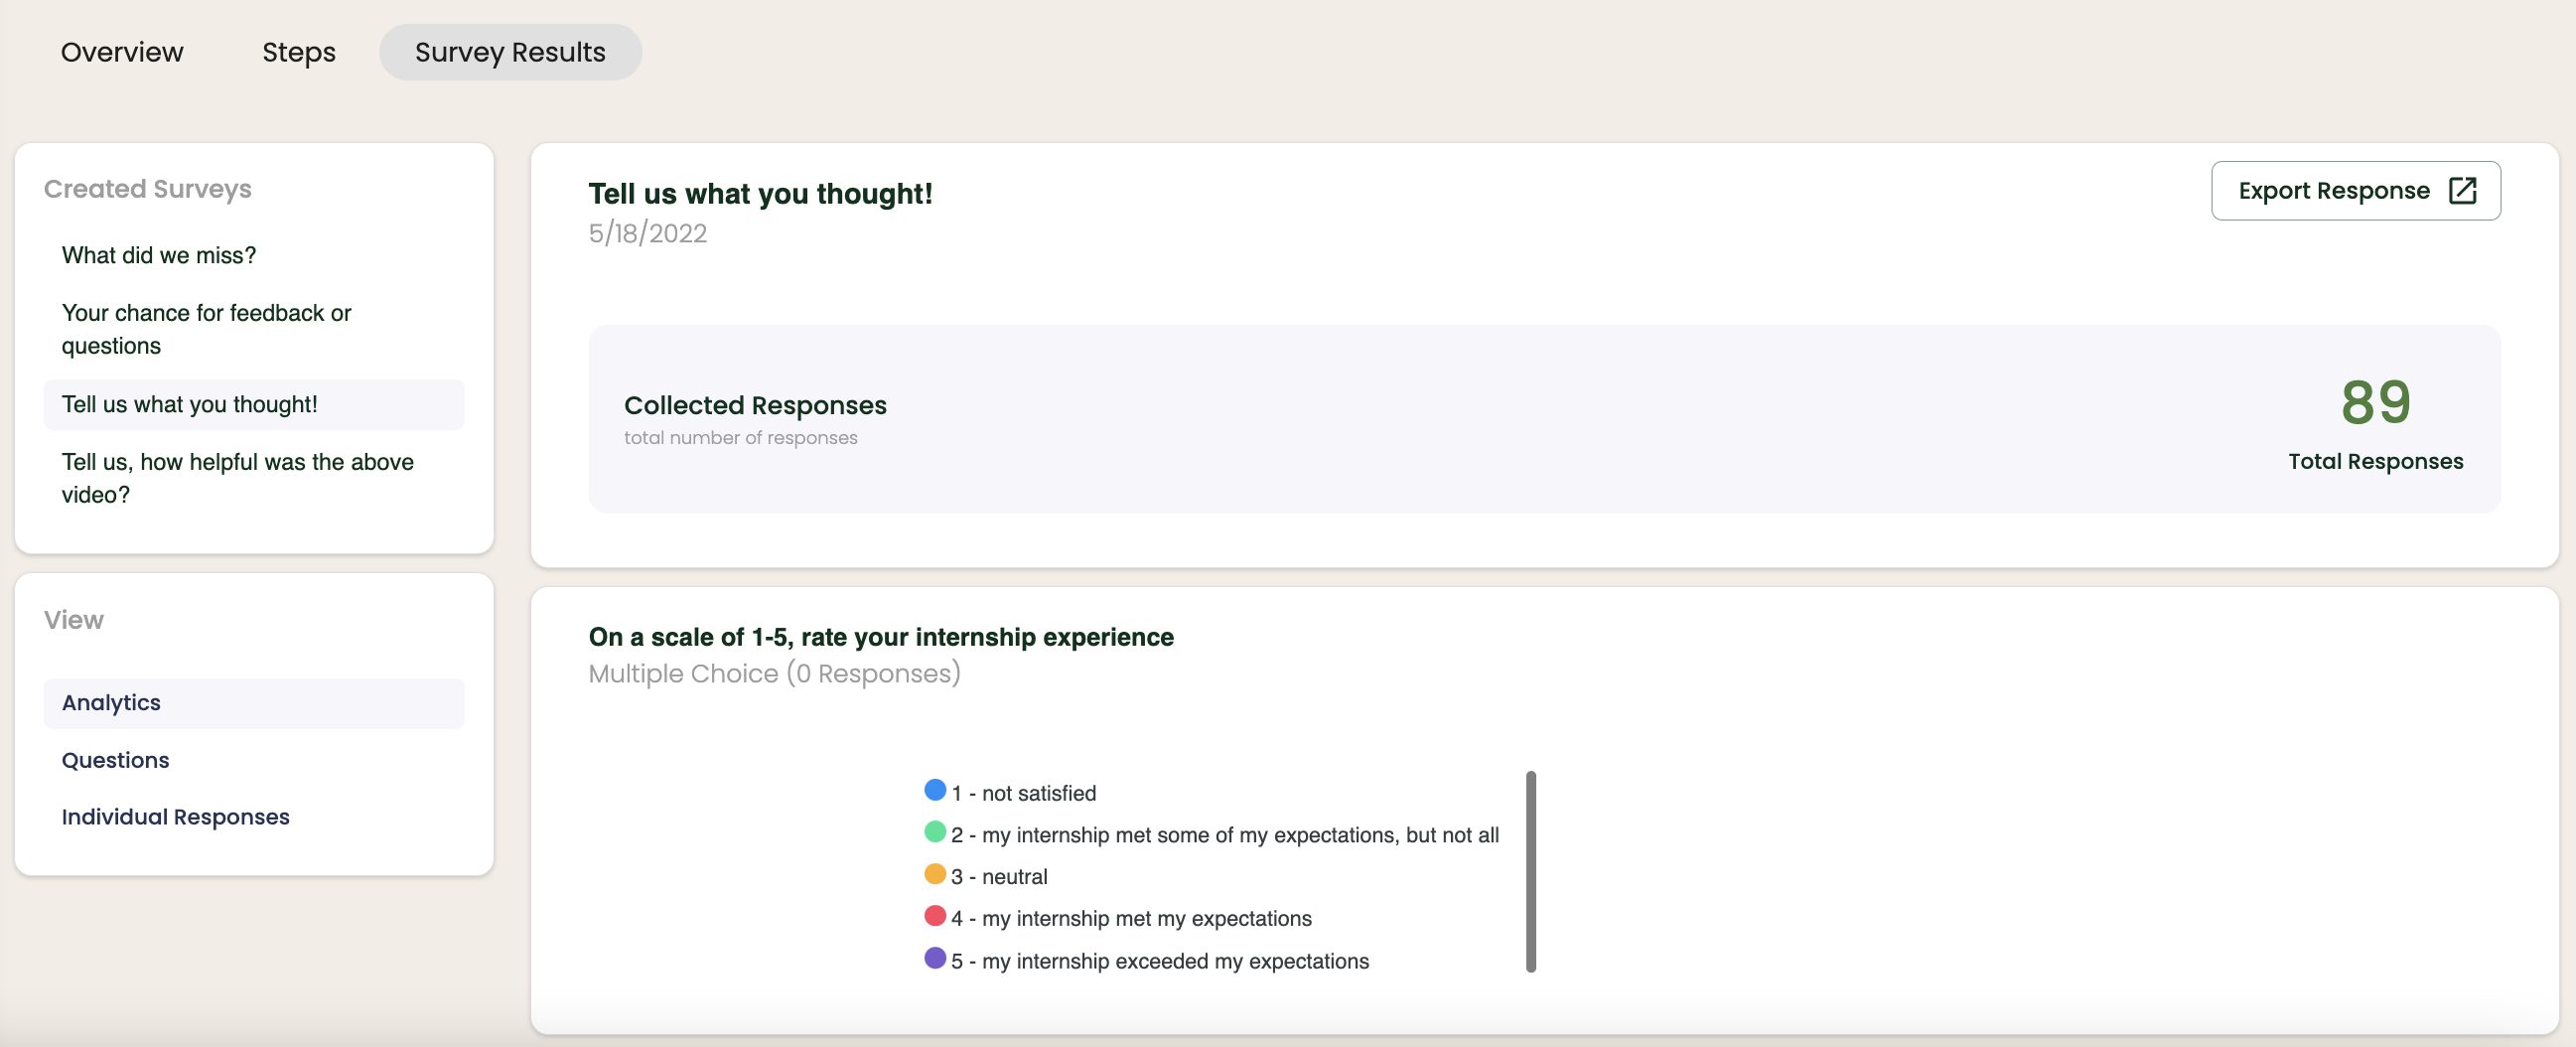
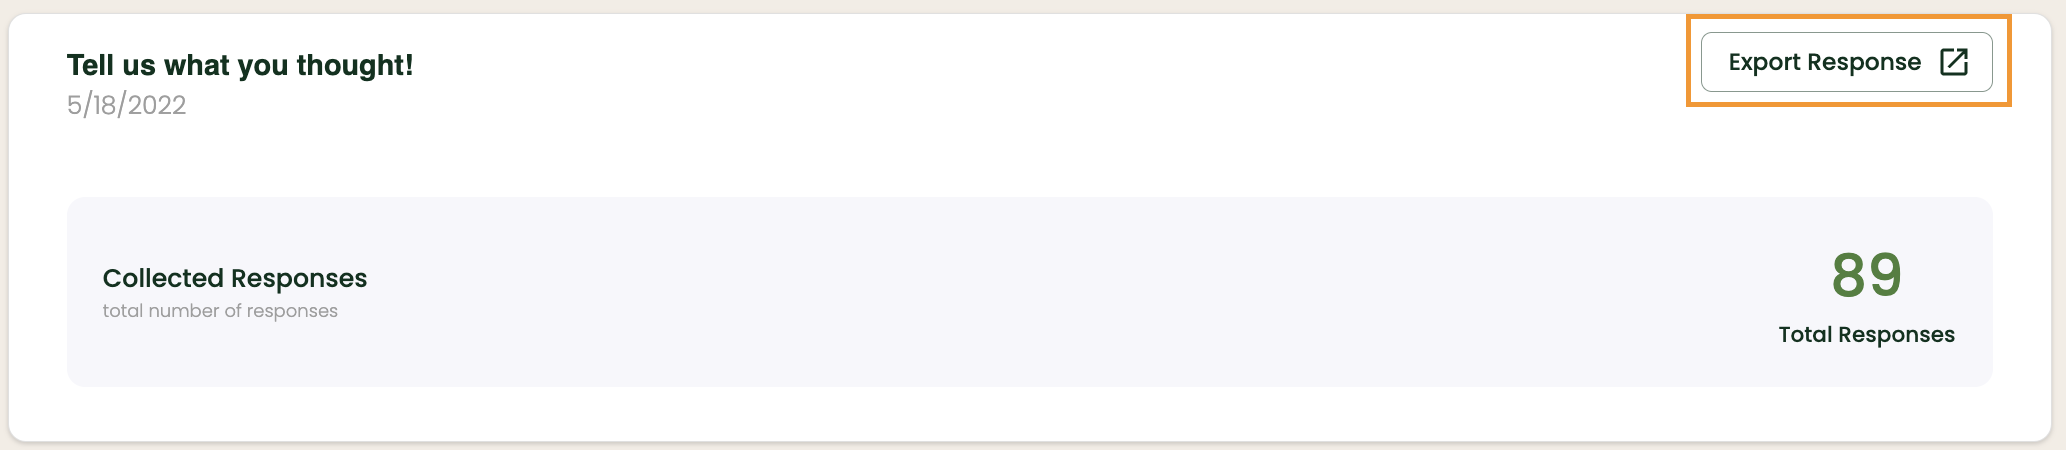
Export Survey Responses
In addition to viewing the data within the platform, you will always be able to export a CSV file for each Survey as well. Simply click the Export Response button in the upper right hand corner to start the instant download.